How to (actually) prove it - New Frontiers of Mathematics & Computing in Lean
lean proof_assistant constructive_mathematics
How exactly do mathematicians prove it? – By which I mean, what is the process they use to sit down and write proofs? How do they conjecture lemmas; what problems do they decide to tackle first? and why?
While such questions have previously been the subject of much mystery, recent developments, namely at the forefront of mechanised mathematics, is promising to reveal these trade secrets for the first time in history.
In particular, I am referring here to the recent interest by prominent mathematicians (such as Terence Tao, Kevin Buzzard, etc.) to formalise, real, novel and cutting-edge mathematical results the Lean Theorem prover.
Of course, mathematicians gain a lot by doing this1, machine checked proofs reduce barriers to entry, allow collaborations at unprecedented scales, and provide the highest assurances of correctness that humanity can provide, but at the same time, there are additional benefits that this also provides non-mathematicians: namely, a unique view into the minds of mathematicians and how they actually go about proving things.
In this (somewhat short) blog post, my main goal is to build excitement for this new frontier of mathematics and computing that has recently opened up, quickly explain where and why this data is showing up, and on the plus side, we'll get to see some fun animations (that you can run in your browser yourself!).
(This one is a video for accessibility, the next few will be in javascript.)
Lean Blueprints
The magic ingredient here is this weird little tool for planning Lean projects called Lean Blueprints.
Blueprints are a mechanism mathematicians have designed for planning out formalisations of their results. When translating a pen and paper result into a proof assistant, a mathematician must first encode all the necessary definitions, helper lemmas and so on before they can write the proof. The blueprint serves as a mechanism to keep track of this process.
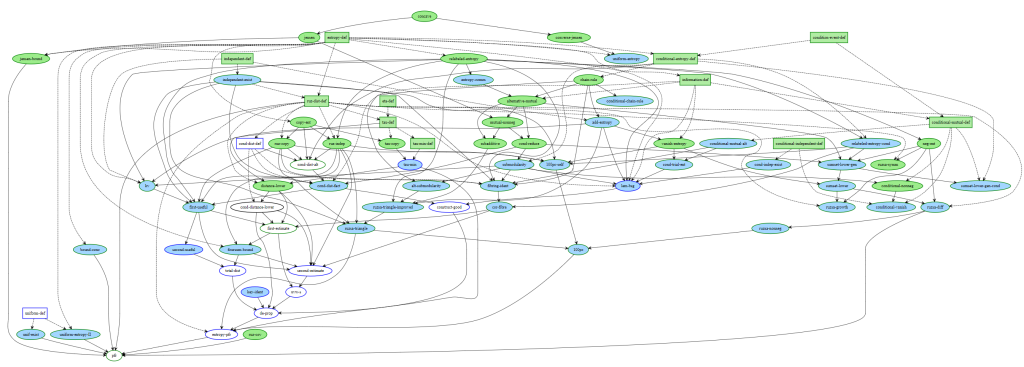
The above image shows an example blueprint, taken from Terence Tao's blog post on the PFR formalistion. It's a graph where the nodes represent different definitions, lemmas and theorems in the formalisation. The colour indicates the status of the formalisation. Green means that it is proven; light blue means that they can be stated but have not been proven, and the remaining nodes (black here) are those that can not even be written down yet (they might be require some definitions to be written down first).
The reason this is exciting is because for the first time we have features for proof assistants that have been developed by mathematicians for mathematicians, rather than by computer scientists, as was the case before in proof assistants such as Rocq. Furthermore, as these formalisations are done in version control, we actually have unique access to see how the blueprint itself changed over time as the project was formalised.
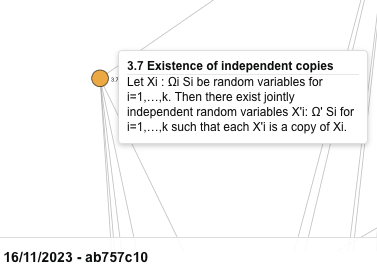
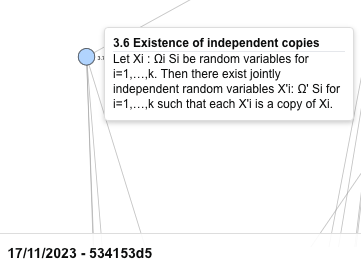
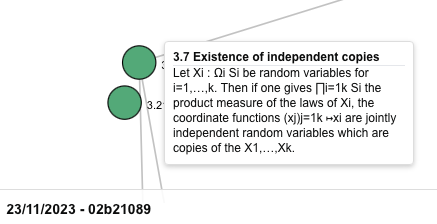
For example, if we keep track of a single node, we can see how it goes from not even being ready to be stated (yellow), stated (blue) and proven (green):
If we look at the state of the graph around these nodes, we have access to a huge amount of data providing unique insights into how mathematicians go about actually proving stuff and build new tools, techniques, maybe train a few ML models, to help mathematicians prove things.
To get the ball rolling, I've been playing around with extracting this data from the version control of active Lean formalisations and trying to plot it out.
Below is a visualisation of the evolution of the Lean Blueprint for Terence Tao's formalisation of the Polynomial Freiman Ruzsa conjecture: (Github URL: https://github.com/teorth/pfr)
If you play the animation, (it's quite calming), you can see how the blueprint graph is built up by the mathematicians over time. We can pause the animation whenever we see something interesting and take a look at what happened. If you watch for a while you'll see that very often the the graph grows in bursts of yellow bubbles, where presumably some mathematician has sat down and sketched out another part of the proof and broken it down into fragments for others to formalise. Then as the formalisation progresses, these nodes are gradually verified and go from blue to finally green.
Obviously, this is not a particularly deep observation, and was just the result of watching the graph for a bit, but I do think this data is really rich with a lot of previously hidden insights into how these proofs are done.
The code to generate this data, for which this blog post is partially an advertisement for, is available on my Github: https://github.com/kiranandcode/lean4-blueprint-extractor/tree/main
Exploring Active Lean Verification Projects
In the rest of this post, I'm just going to drop more visualisations for a few other active Lean formalisations and provide some high level observations.
The Kelley-Meka bound on Roth numbers
Github URL: https://github.com/YaelDillies/LeanAPAP
The timeline visualisation here provides some interesting insight into how sporadic some of the development of the blueprint is here. Notably, the timeline only shows commits that touched the blueprint, so likely the gaps here correspond to places where mathematicians were mostly struggling with proving stuff in Lean itself, and the dashes correspond to places where substantial progress was made on the verification effort.
Carleson's theorem
Github URL: https://github.com/fpvandoorn/carleson
This project illustrates a slightly different pattern of development by the mathematicians. It seems like the development starts with a few "Cambrian" explosions where one researcher sets about stating a large number of theorems all at once. Interestingly, as the project progresses, the number of yellow theorems and definitions that can't even be stated grows, and it is only to the later stages people make progress on actually proving things. As an aside, it is quite fun to watch the graph gradually shift in hue to all green.
Relations of equational theories of Magmas
Github URL: https://github.com/teorth/equational_theories
Of the projects that we've looked at in this blog post, this is by far the most exciting. For those unaware of the project, the Equational Theories formalisation effort, proposed here, corresponds to an attempt by Terence Tao and collaborators to investigate developing new mathematics in Lean first, rather than formalising existing works. The specifics of the problem itself are probably better explained by the mathematicians, but the key point is that this project itself provides us a view into what the mathematics of the future might look like, with mathematicians working hand in hand with machines to prove fun and exciting new theorems. This is somewhat reflected in the blueprint itself, where unlike a lot of the other blueprints we've seen, the project consistently has a cluster of fully green nodes and new experiments are added slowly as light blue nodes.
Analytic Number Theory Exponent Database
Github URL: https://github.com/teorth/expdb/tree/main
It is interesting to watch this project at the start where the verification was very much in flux. In the graph we can see at the start, the mathematicians seemed to produce a lot of definitions, making several statements that they could prove, but then as the project developed, these initial statements experienced a lot of churn — maybe they weren't appropriate for the formalisation? — and then midway into the project, the developers settled back into the more standard approach of first writing down several informal statements and gradually formalising them.
Infinity-cosmos theory Formalisation
Github URL: https://github.com/emilyriehl/infinity-cosmos
This one is interesting in that it is some formalisation of, I believe, some category/homotopy theory related mathematics, which is one area of mathematics where proof assistants have historically already been somewhat successful. The evolution of the blueprint does look markedly different from how they've evolved in the formalisations of more traditional mathematics. In particular, the developers never seem to state too many informal statements at once — we don't ever see the explosion of nodes that we've seen before — and several statements are written down in a form where they can directly be formalised.
Fermat's Last Theorem
Github URL: https://github.com/ImperialCollegeLondon/FLT
@@ Of the projects we've looked at in this post, this one is definitely the most experimental, by looking at the graph, you can really tell that the authors here are still in the process of working out how to break down the proof: the graph is disconnected for most of the history
Fermat's Last Theorem for Exponent 3
Github URL: https://github.com/pitmonticone/FLT3
The history of this project is somewhat similar to the formalisation of Fermat's Last theorem in general seen previously. Interestingly, it seems like there's a fair number of nodes that are added without text? this could be a bug in my extraction code, but I think it corresponds to cases where the Lean code was written first, and the nodes in the blueprint were not yet fleshed out.n
Formalization of the existence of sphere eversions
Github URL: https://github.com/leanprover-community/sphere-eversion
This project seems to be a more Lean-driven formalisation, there aren't as many explosions of informal statements as characteristic of when mathematicians take a pen and paper proof and brain-dump it into a blueprint. The formalisation seems to build up the necessary theories first, forming clusters of all green nodes, and then slowly connecting them up together. If I had to guess, I'd assume that the blueprints for projects by computer scientists might look very similar to this.
Footnotes
Admittedly, I am a tad biased here, working in formal methods for my research.